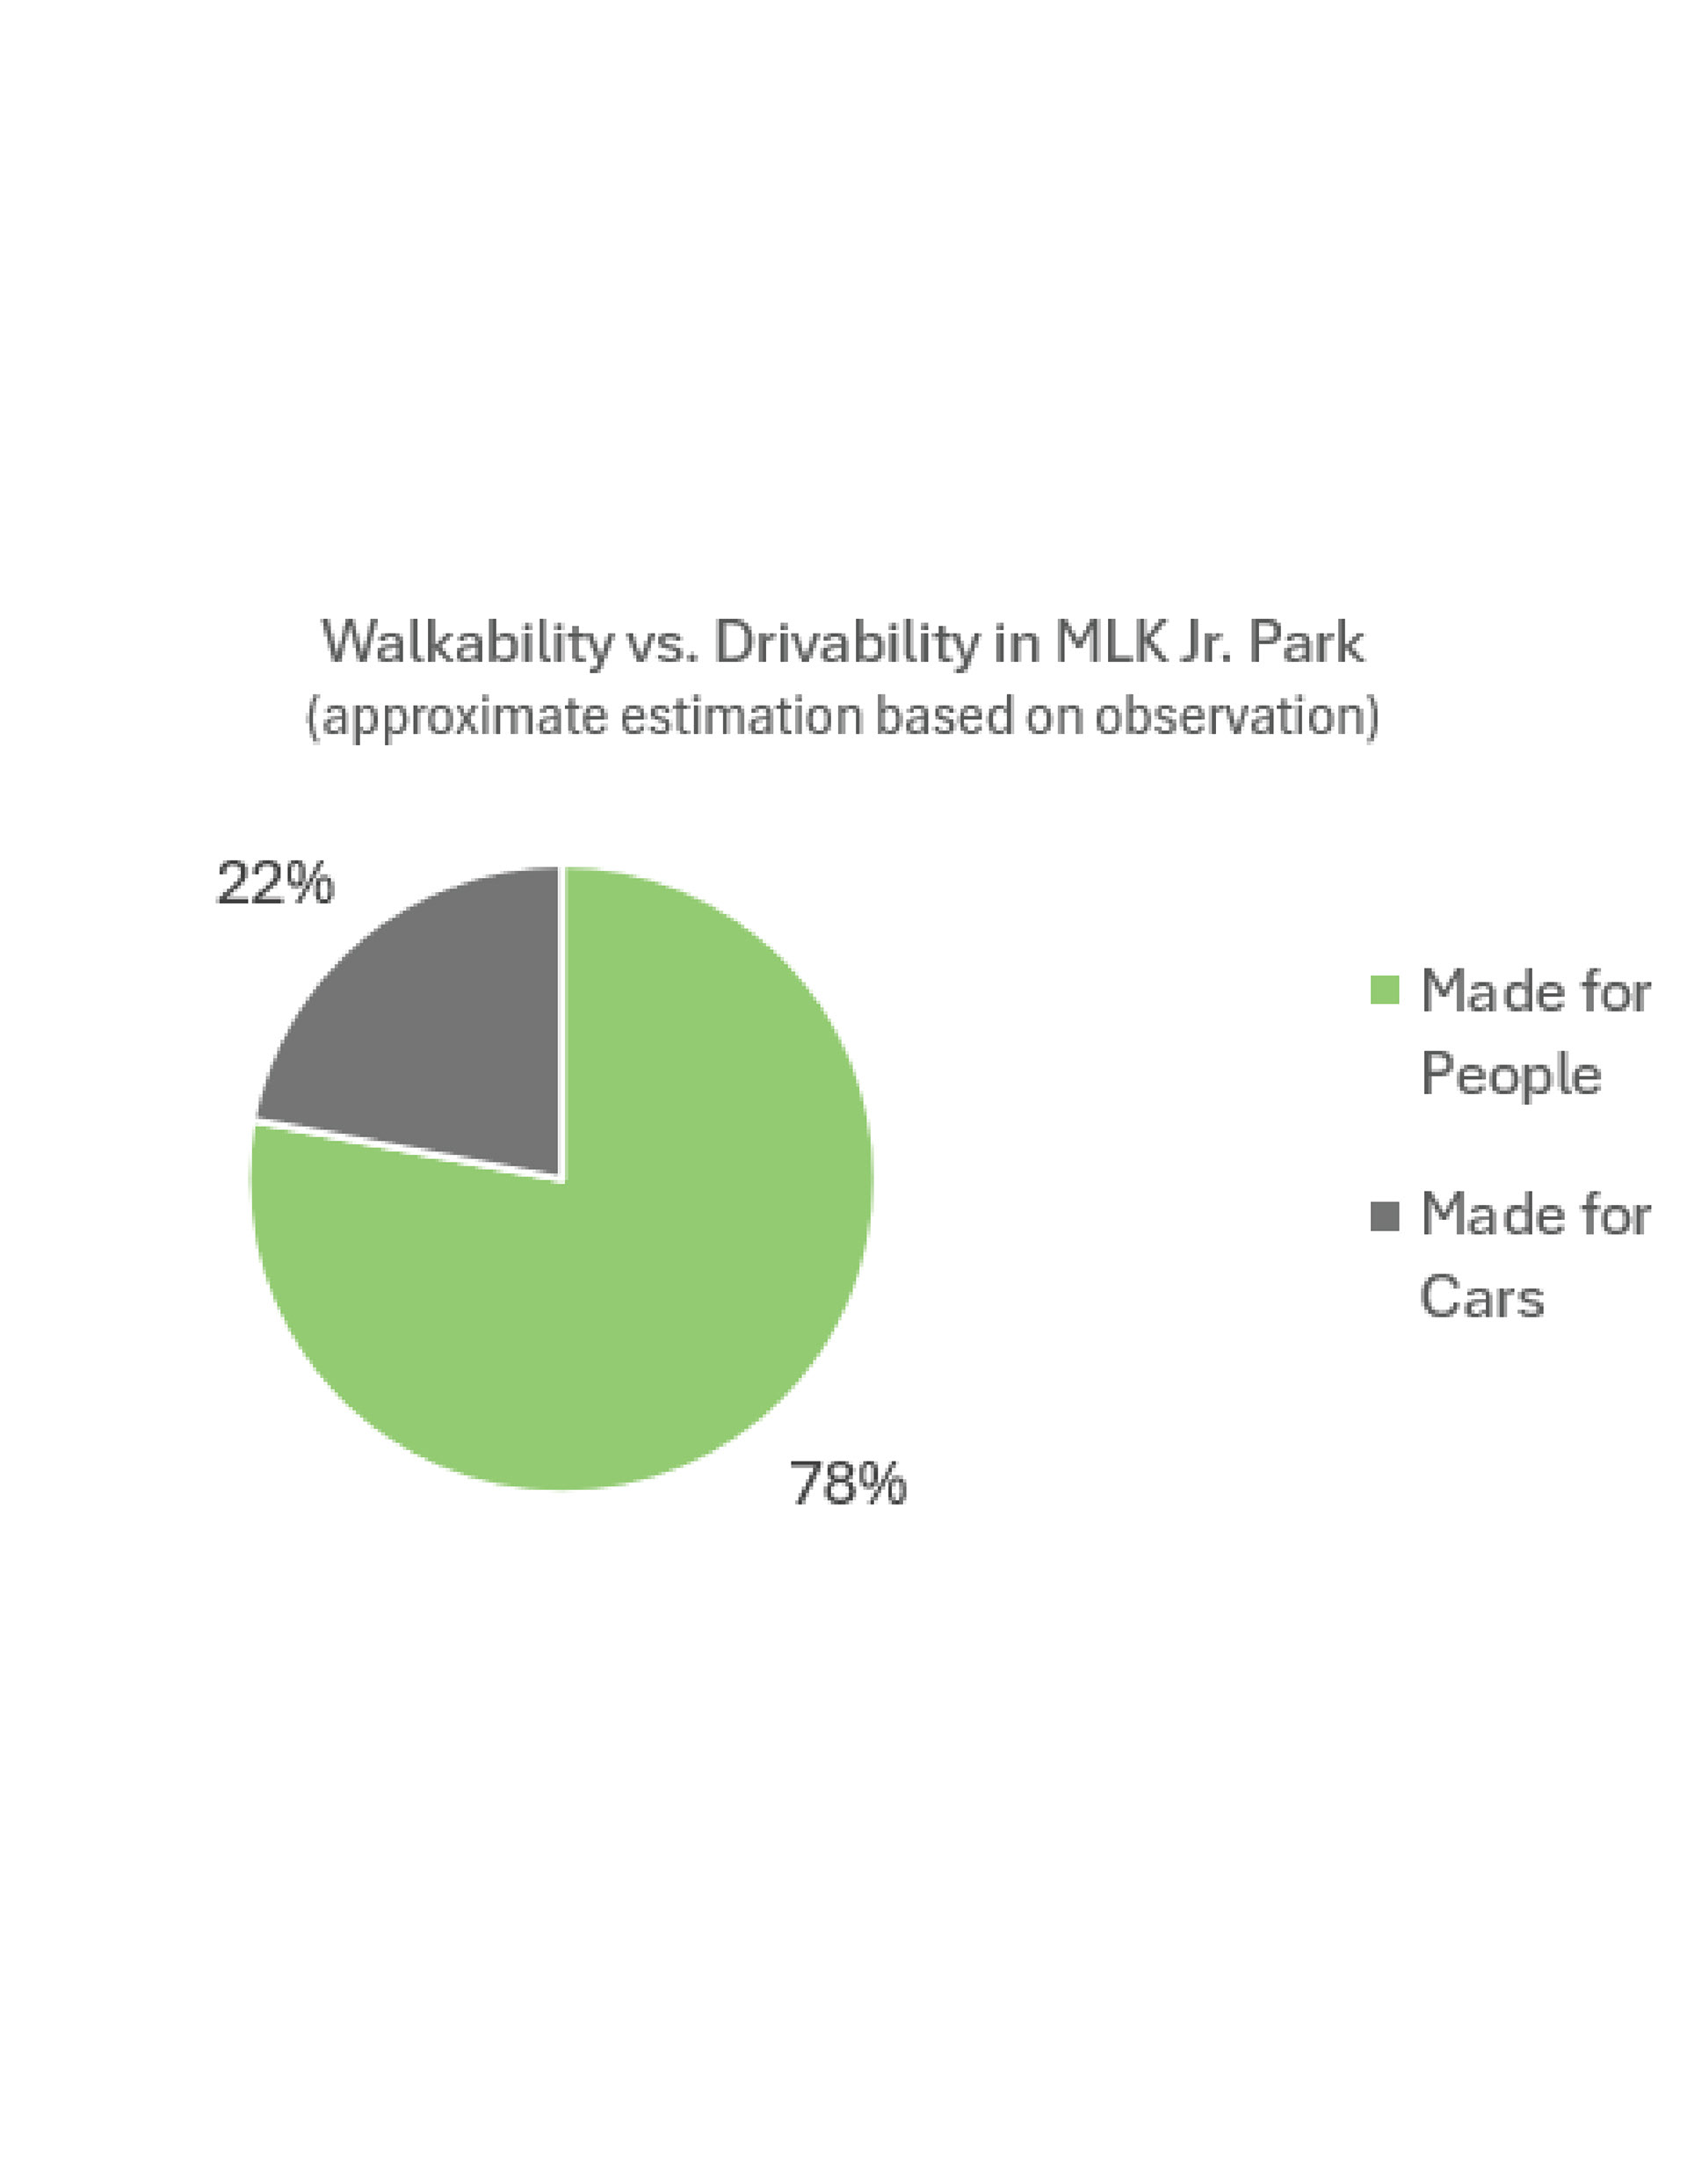
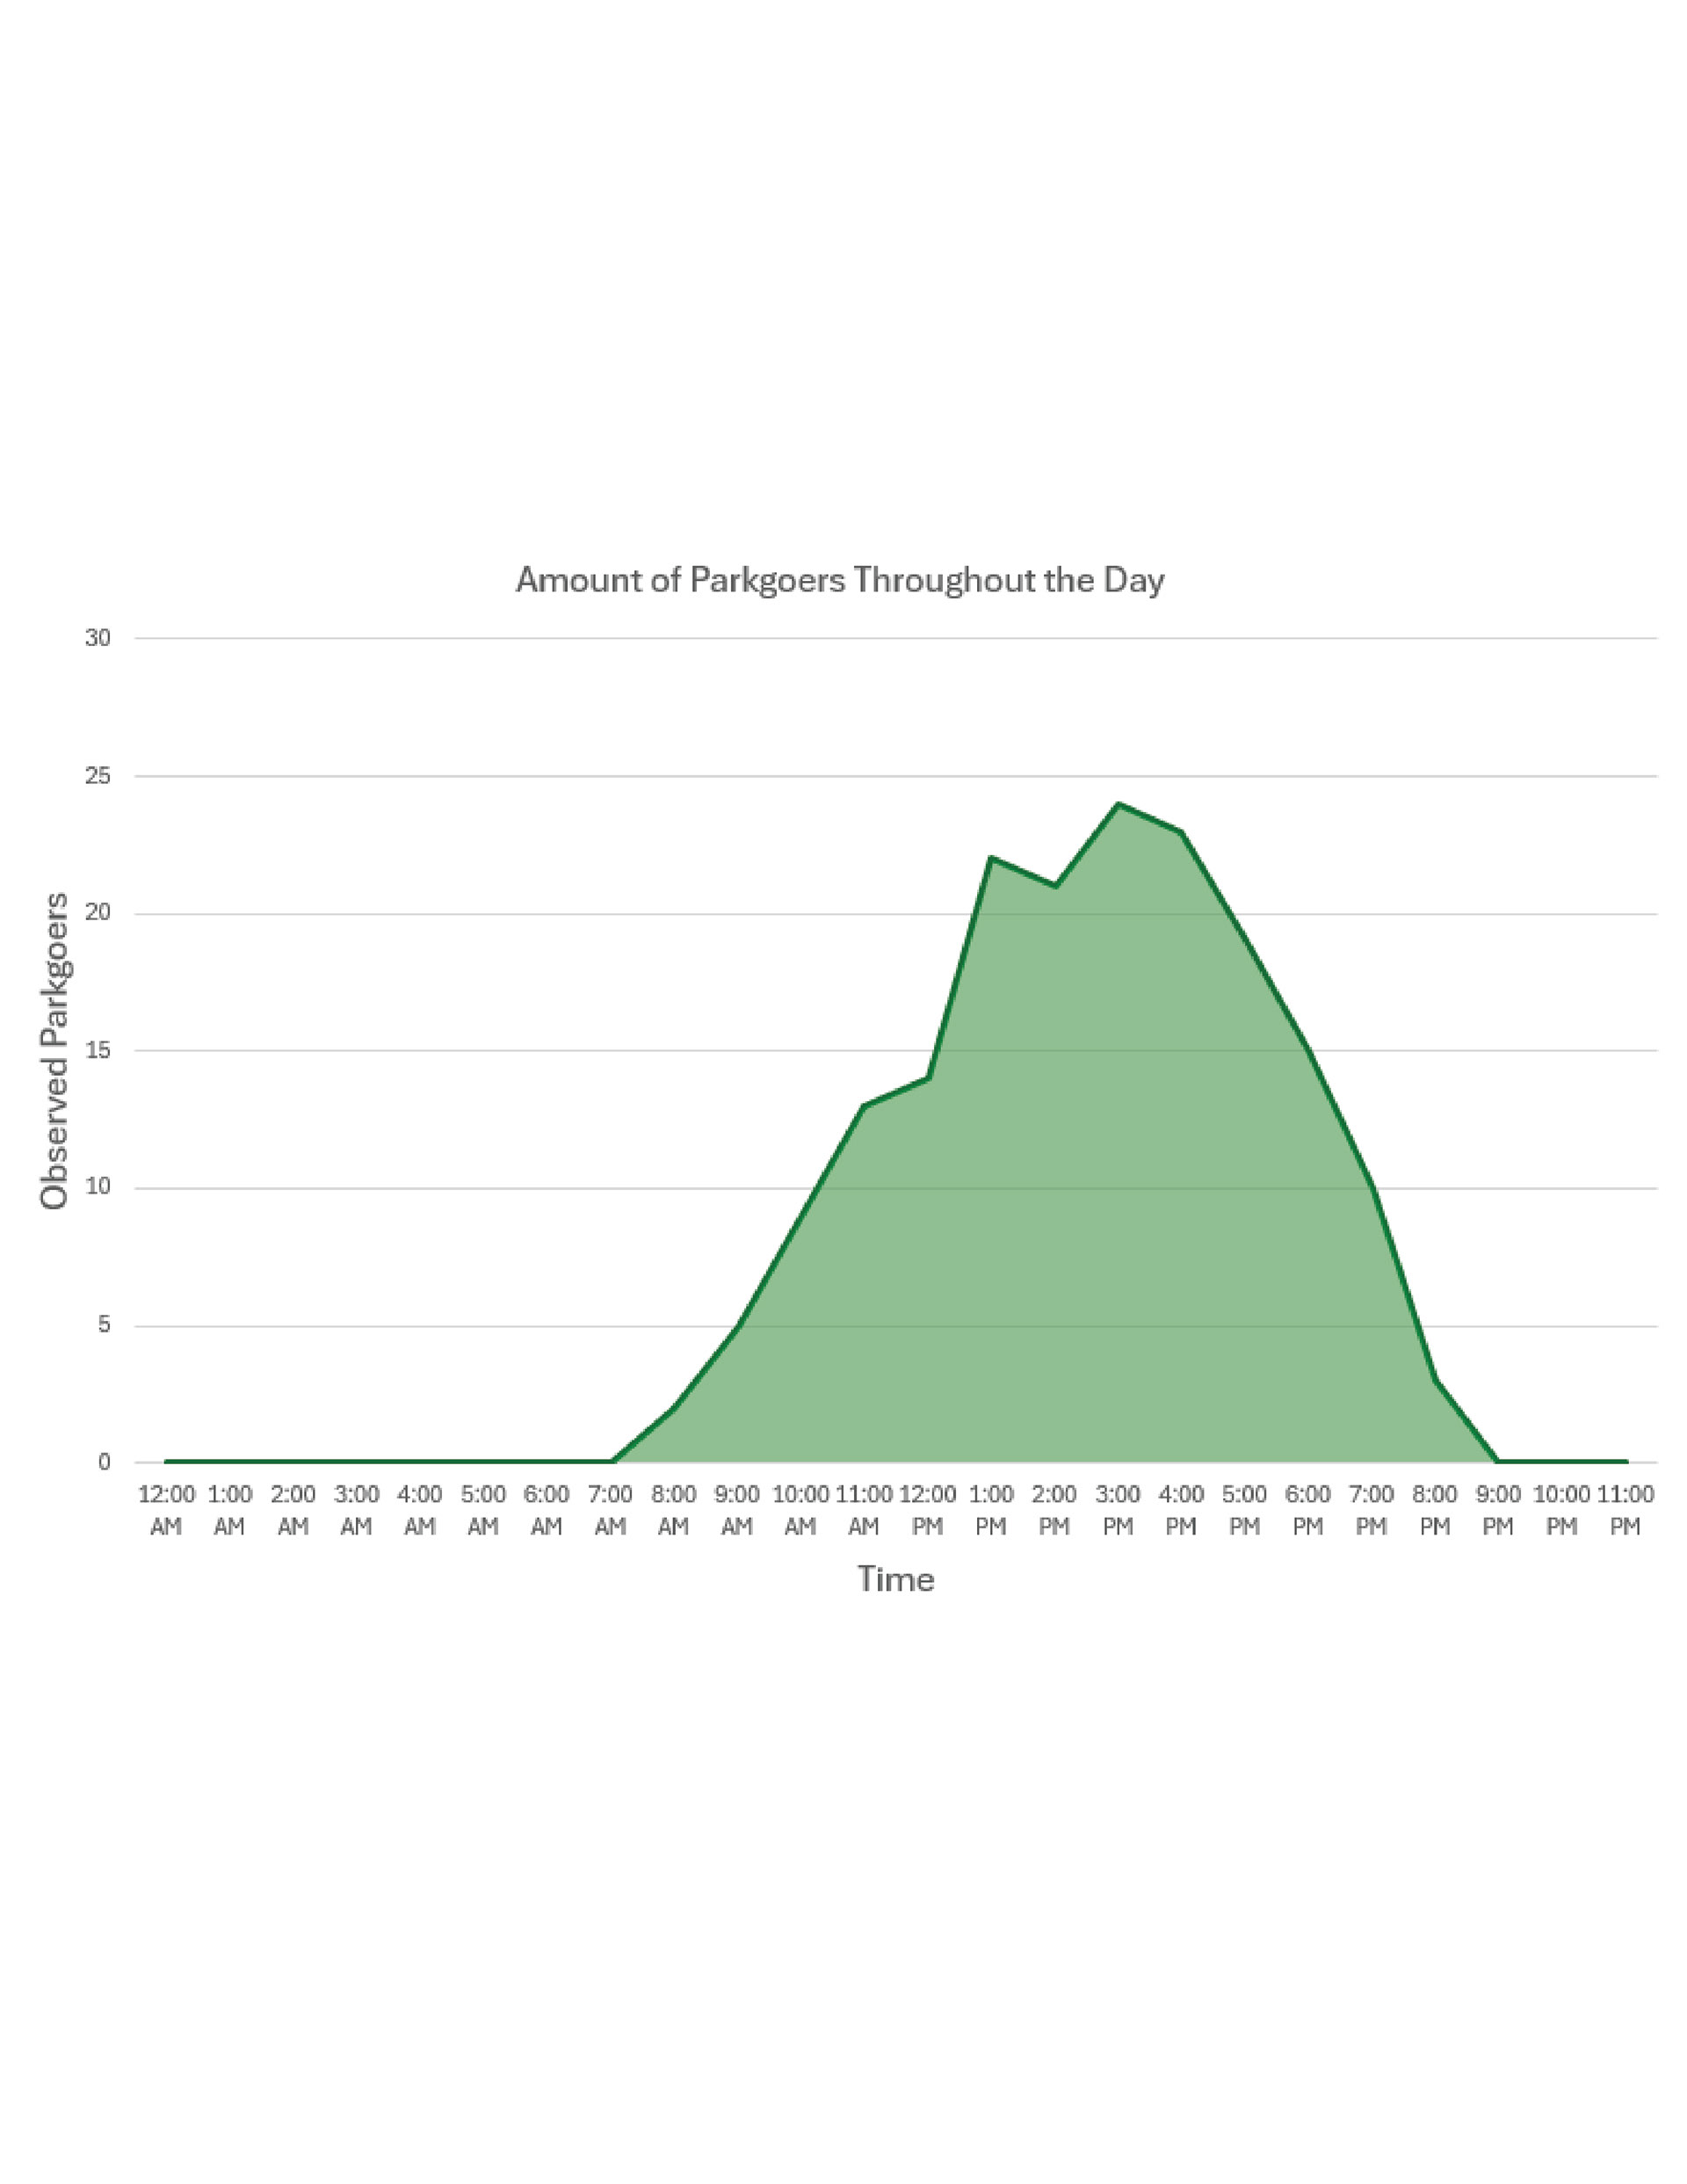
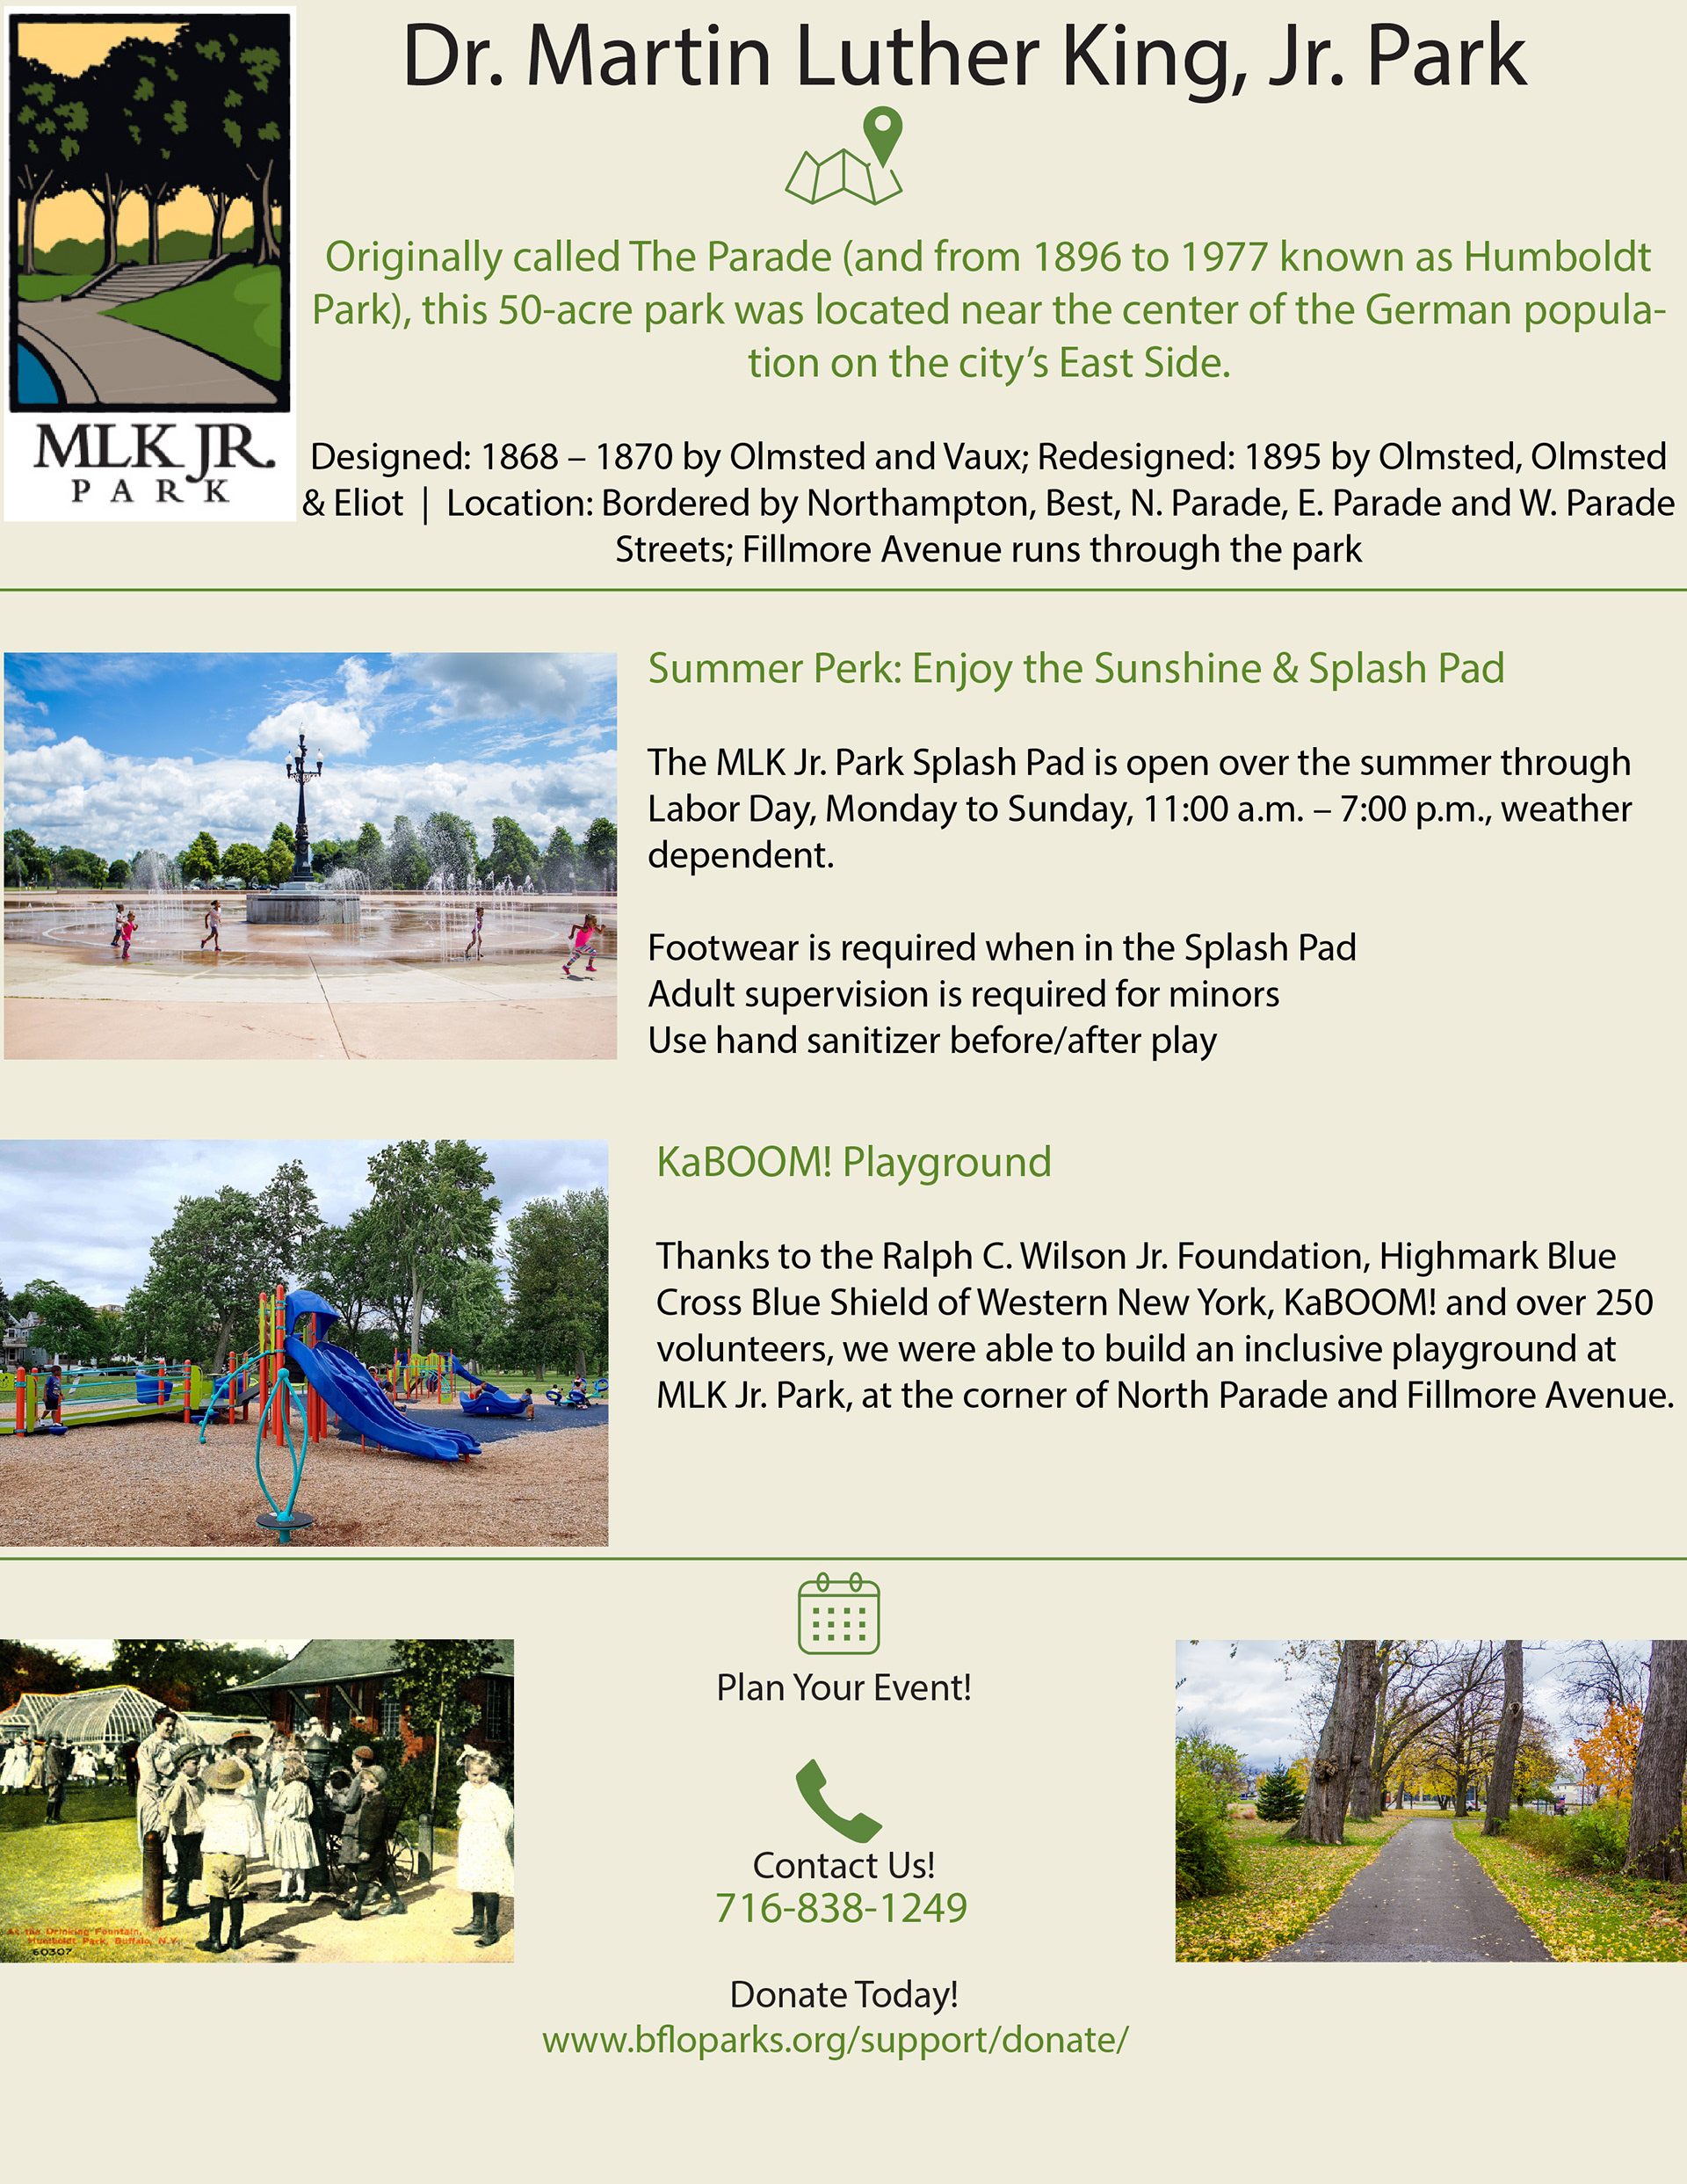
Using the sites we selected from Assignment 5, Assignment 6 also involves Martin Luther King Jr. Park. We were tasked with designing infographics based on our observations of our sites. Specifically, we were tasked with creating charts for Age Ranges within the Census Tract, the number of people who use the site in 24 hours, a third chart based on our observations, a sign that could realistically be at our site, and finally a poster detailing what our site is and what goes on there. The charts were created in Microsoft Excel, The sign was created in Krita, and the poster was created in Adobe Illustrator.
Completed 3/11/24 - Spring Semester